Introduction
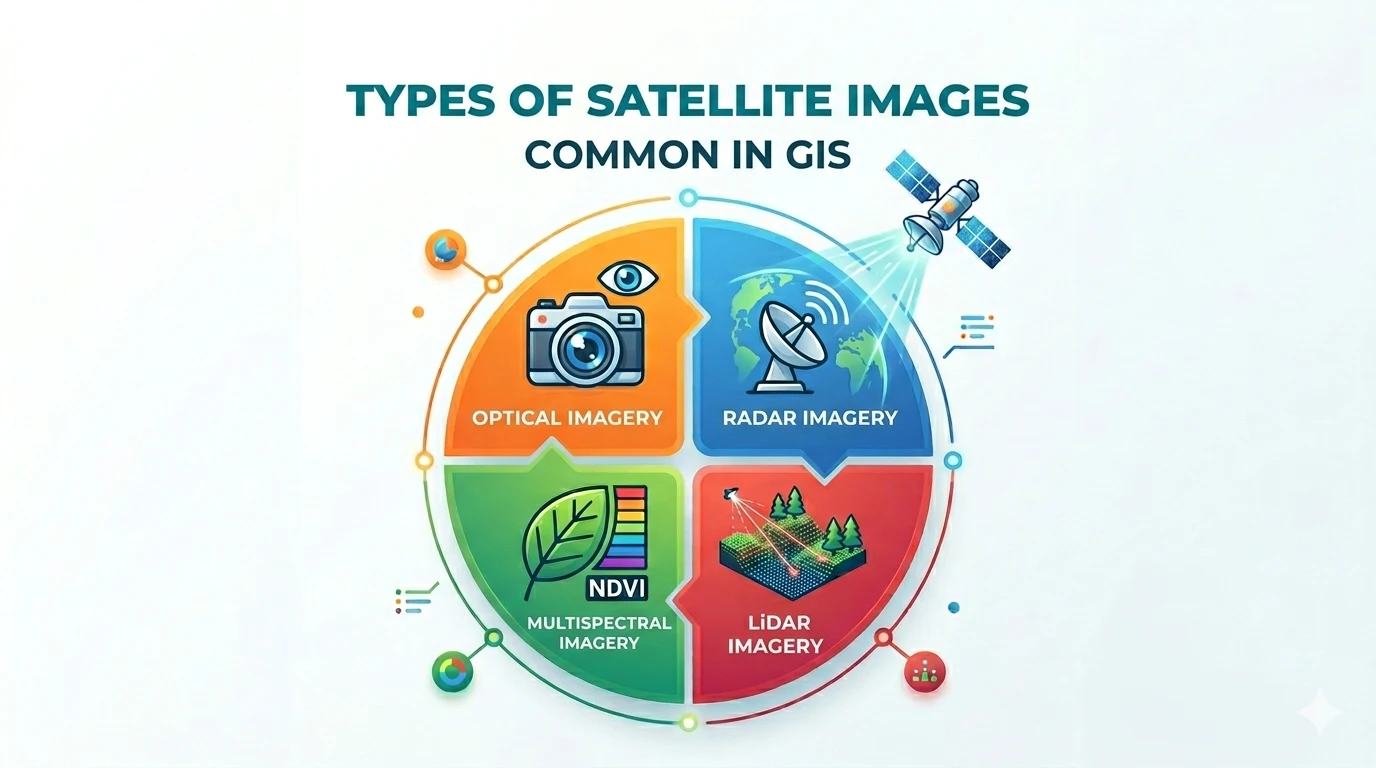
Satellite imagery is the foundational data source in Geographic Information Systems (GIS). From monitoring land-use changes and managing natural resources to urban planning — satellites provide a bird’s-eye view that no other tool can replicate.
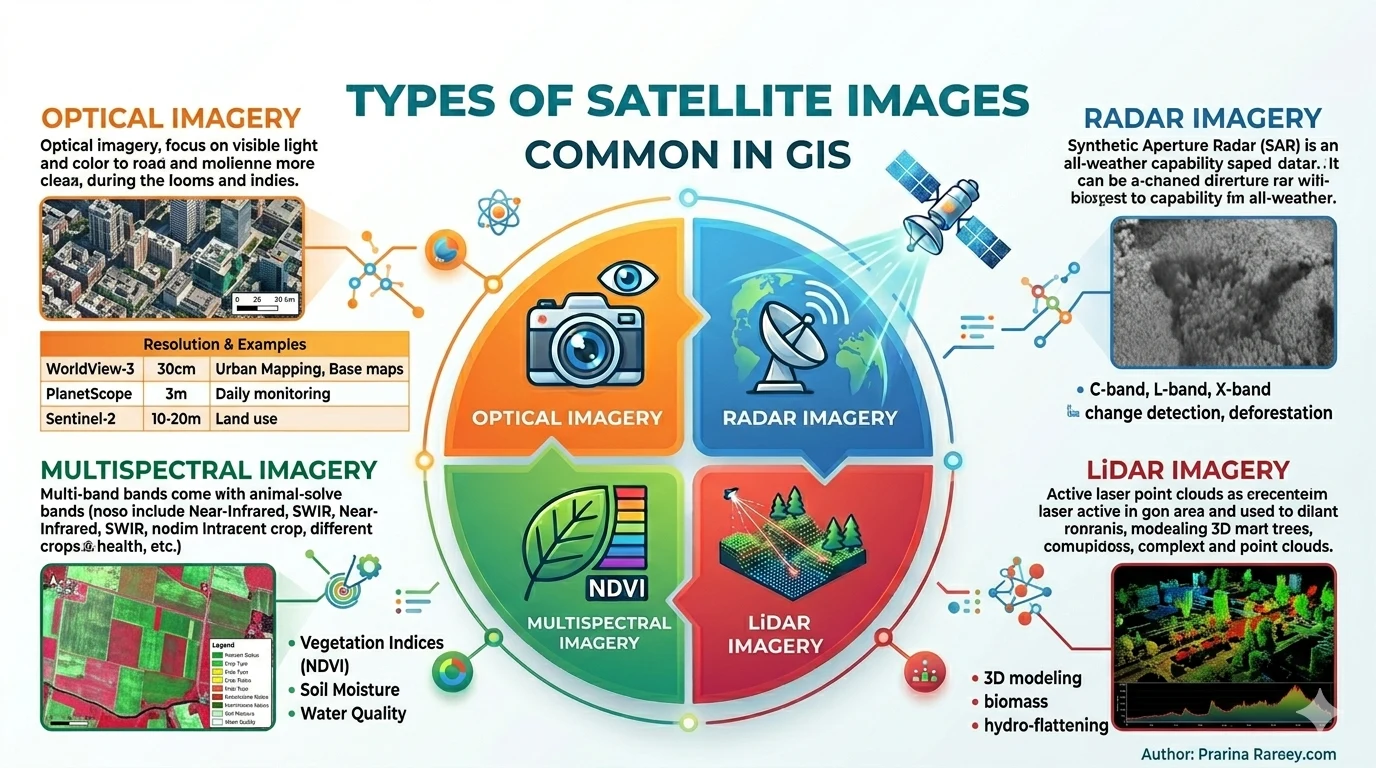
This article helps you understand the common types of satellite imagery, their characteristics, and applications so you can choose the right one for your GIS project.
1. Optical Imagery
How it works
Optical imagery captures reflected light from Earth’s surface within the visible spectrum — similar to how the human eye sees. Each pixel contains intensity values for red, green, and blue (RGB) channels.
Characteristics
- High resolution: Some commercial satellites reach 30 cm/pixel, allowing detection of cars and pedestrians
- Natural colors: Easy to interpret visually, suitable for non-technical users
- Weather dependent: Heavily affected by clouds, fog, and rain
Key satellites
| Satellite | Resolution | Notable Features |
|---|---|---|
| WorldView-3/4 (Maxar) | 30 cm | Commercial, highest quality |
| GeoEye-1 | 50 cm | Global coverage, many bands |
| PlanetScope | 3-5 m | Daily revisit, wide area |
| Sentinel-2 | 10-60 m | Free, ESA, multispectral |
| Landsat 8/9 | 15-100 m | Free, >50 years of history |
Common applications
- Base maps for GIS
- Urban and infrastructure monitoring
- Disaster response, flood assessment
- Precision farming agriculture
2. Radar Imagery (SAR)
How it works
Radar (Radio Detection and Ranging) actively emits radio waves toward Earth’s surface and captures the reflected signal. Unlike optical imagery, radar generates its own signal — requiring no sunlight or clear skies.
Characteristics
- All-weather capability: Penetrates clouds, rain — works day and night
- Elevation measurement: SAR (Synthetic Aperture Radar) enables high-accuracy Digital Elevation Models
- Sensitive to moisture and structure: Radar backscatter varies with soil moisture and surface texture
Key satellites
| Satellite | Band | Notable Features |
|---|---|---|
| Sentinel-1 | C-band | Free, global, InSAR |
| ALOS-2 (PALSAR) | L-band | Vegetation penetration, forest management |
| TerraSAR-X | X-band | High resolution, commercial |
| ICESat-2 | Laser | Elevation, ice sheets |
Common applications
- InSAR (Interferometric SAR): Ground displacement monitoring, urban subsidence warning
- Forest monitoring: L-band penetrates canopy, biomass measurement
- Maritime, oil & gas: Oil spill detection, vessel tracking
- Weather: Cloud radar (C/Ku band)
3. Multispectral and Hyperspectral Imagery
The difference
Multispectral captures 3 to 15 spectral bands across visible, NIR, SWIR, thermal regions.
Hyperspectral captures hundreds of continuous spectral bands, creating a unique “spectral fingerprint” for each object on the ground.
Specialized applications
| Type | Applications |
|---|---|
| Multispectral | Land cover classification, NDVI index, crop monitoring |
| Hyperspectral | Mineral detection, pollution mapping, plant species differentiation |
Notable examples
- Landsat 8/9: 11 multispectral bands, free, 16-day revisit
- Sentinel-2: 13 bands, designed for NDVI and land monitoring
- PRISMA (Italy): 240-band hyperspectral, 30 m
- EnMAP (Germany): Hyperspectral, launched 2022
4. Thermal Imagery
How it works
Every object above absolute zero (-273°C) emits infrared radiation. Thermal imagery captures this radiation and converts it into temperature values.
GIS applications
- Urban Heat Island monitoring: Detecting hot zones, planning urban greening
- Agriculture: Crop water stress detection
- Disaster management: Wildfire hotspot detection
- Infrastructure: Pipeline inspection, power substations
Key satellites
- Landsat 8 (TIRS) — Thermal band 100 m
- ASTER — 90 m resolution, multiple thermal bands
- ECOSTRESS (ISS) — 70 m, vegetation thermal stress monitoring
5. LiDAR Imagery
How it works
LiDAR (Light Detection and Ranging) emits laser pulses toward the surface and measures the return time. The result is a point cloud — millions of 3D points.
Classification
- Airborne LiDAR: From airplane, drone — wide area coverage
- Terrestrial LiDAR: From ground — detailed engineering surveys
- Satellite LiDAR: GIVE (ICESat-2), GEDI — global coverage
Applications
- Digital Elevation/Terrain Models (DEM/DTM): Centimeter accuracy
- 3D urban surface models: CityGML, Buildings
- Forest management: Tree height, biomass
- Inundation mapping: Flood modeling
6. Low-Resolution Imagery — Large-Area Analysis
Beyond high-resolution imagery, GIS also uses low-resolution images for broad analysis:
| Source | Resolution | Purpose |
|---|---|---|
| MODIS | 250-1000 m | Global monitoring, weather |
| VIIRS | 750 m | Nighttime lights, economy |
| Sentinel-3 | 300 m | Oceans, surface temperature |
How to Choose the Right Imagery
When selecting satellite imagery for a GIS project, consider:
Selection criteria
-
Purpose
- Base map → High-resolution optical imagery
- Change monitoring over time → Time-series (Sentinel, Landsat)
- Ground displacement → InSAR (Sentinel-1)
- 3D modeling → LiDAR
-
Budget
- Free: Landsat, Sentinel-2, Sentinel-1, MODIS
- Commercial: WorldView, GeoEye, Planet (freemium available)
-
Update frequency
- Daily: PlanetScope, Sentinel-2
- Weekly: Landsat, Sentinel-1
- Monthly: High-end commercial satellites
-
Weather conditions
- Tropical regions (cloudy) → Prioritize radar (Sentinel-1)
- Arid regions → Optical imagery is sufficient
Conclusion
Each type of satellite imagery has its own strengths and is suited for different use cases. In practice, GIS projects often combine multiple imagery types to leverage the advantages of each — optical for context, radar for elevation, and LiDAR for 3D detail.
💡 Tip: For field data collection, combine satellite imagery with apps like Geocollect to cross-reference and record ground-truth data — saving time while ensuring high accuracy.
If you need advice on choosing the right satellite imagery for your specific project, feel free to contact TLGeo for consultation.