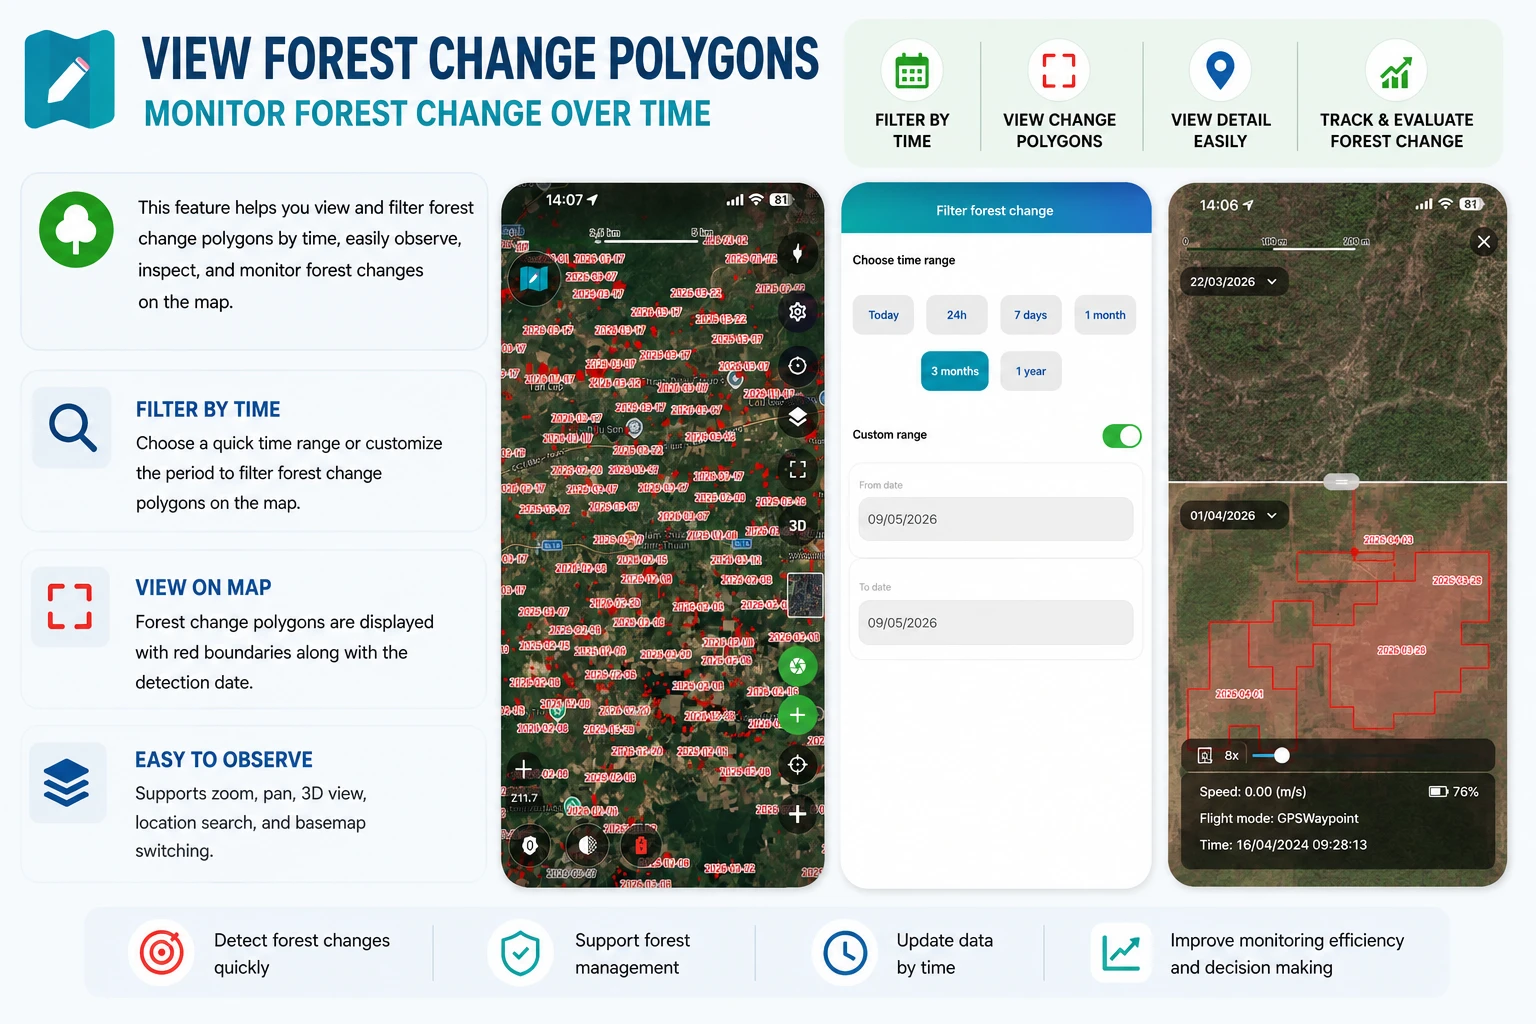
View Forest Change Detection Parcels
Introduction
The View Forest Change Detection Parcels feature in Geocollect helps users track forest area changes over time through satellite imagery.
The system will display:
- Areas with signs of forest change
- Time of change detection
- Comparison of current status between 2 different time points
- Time period filters to reduce the amount of data displayed on the map
This feature effectively supports:
- Deforestation monitoring
- Forest status inspection
- Land use change monitoring
- Checking areas suspected of exploitation or vegetation changes
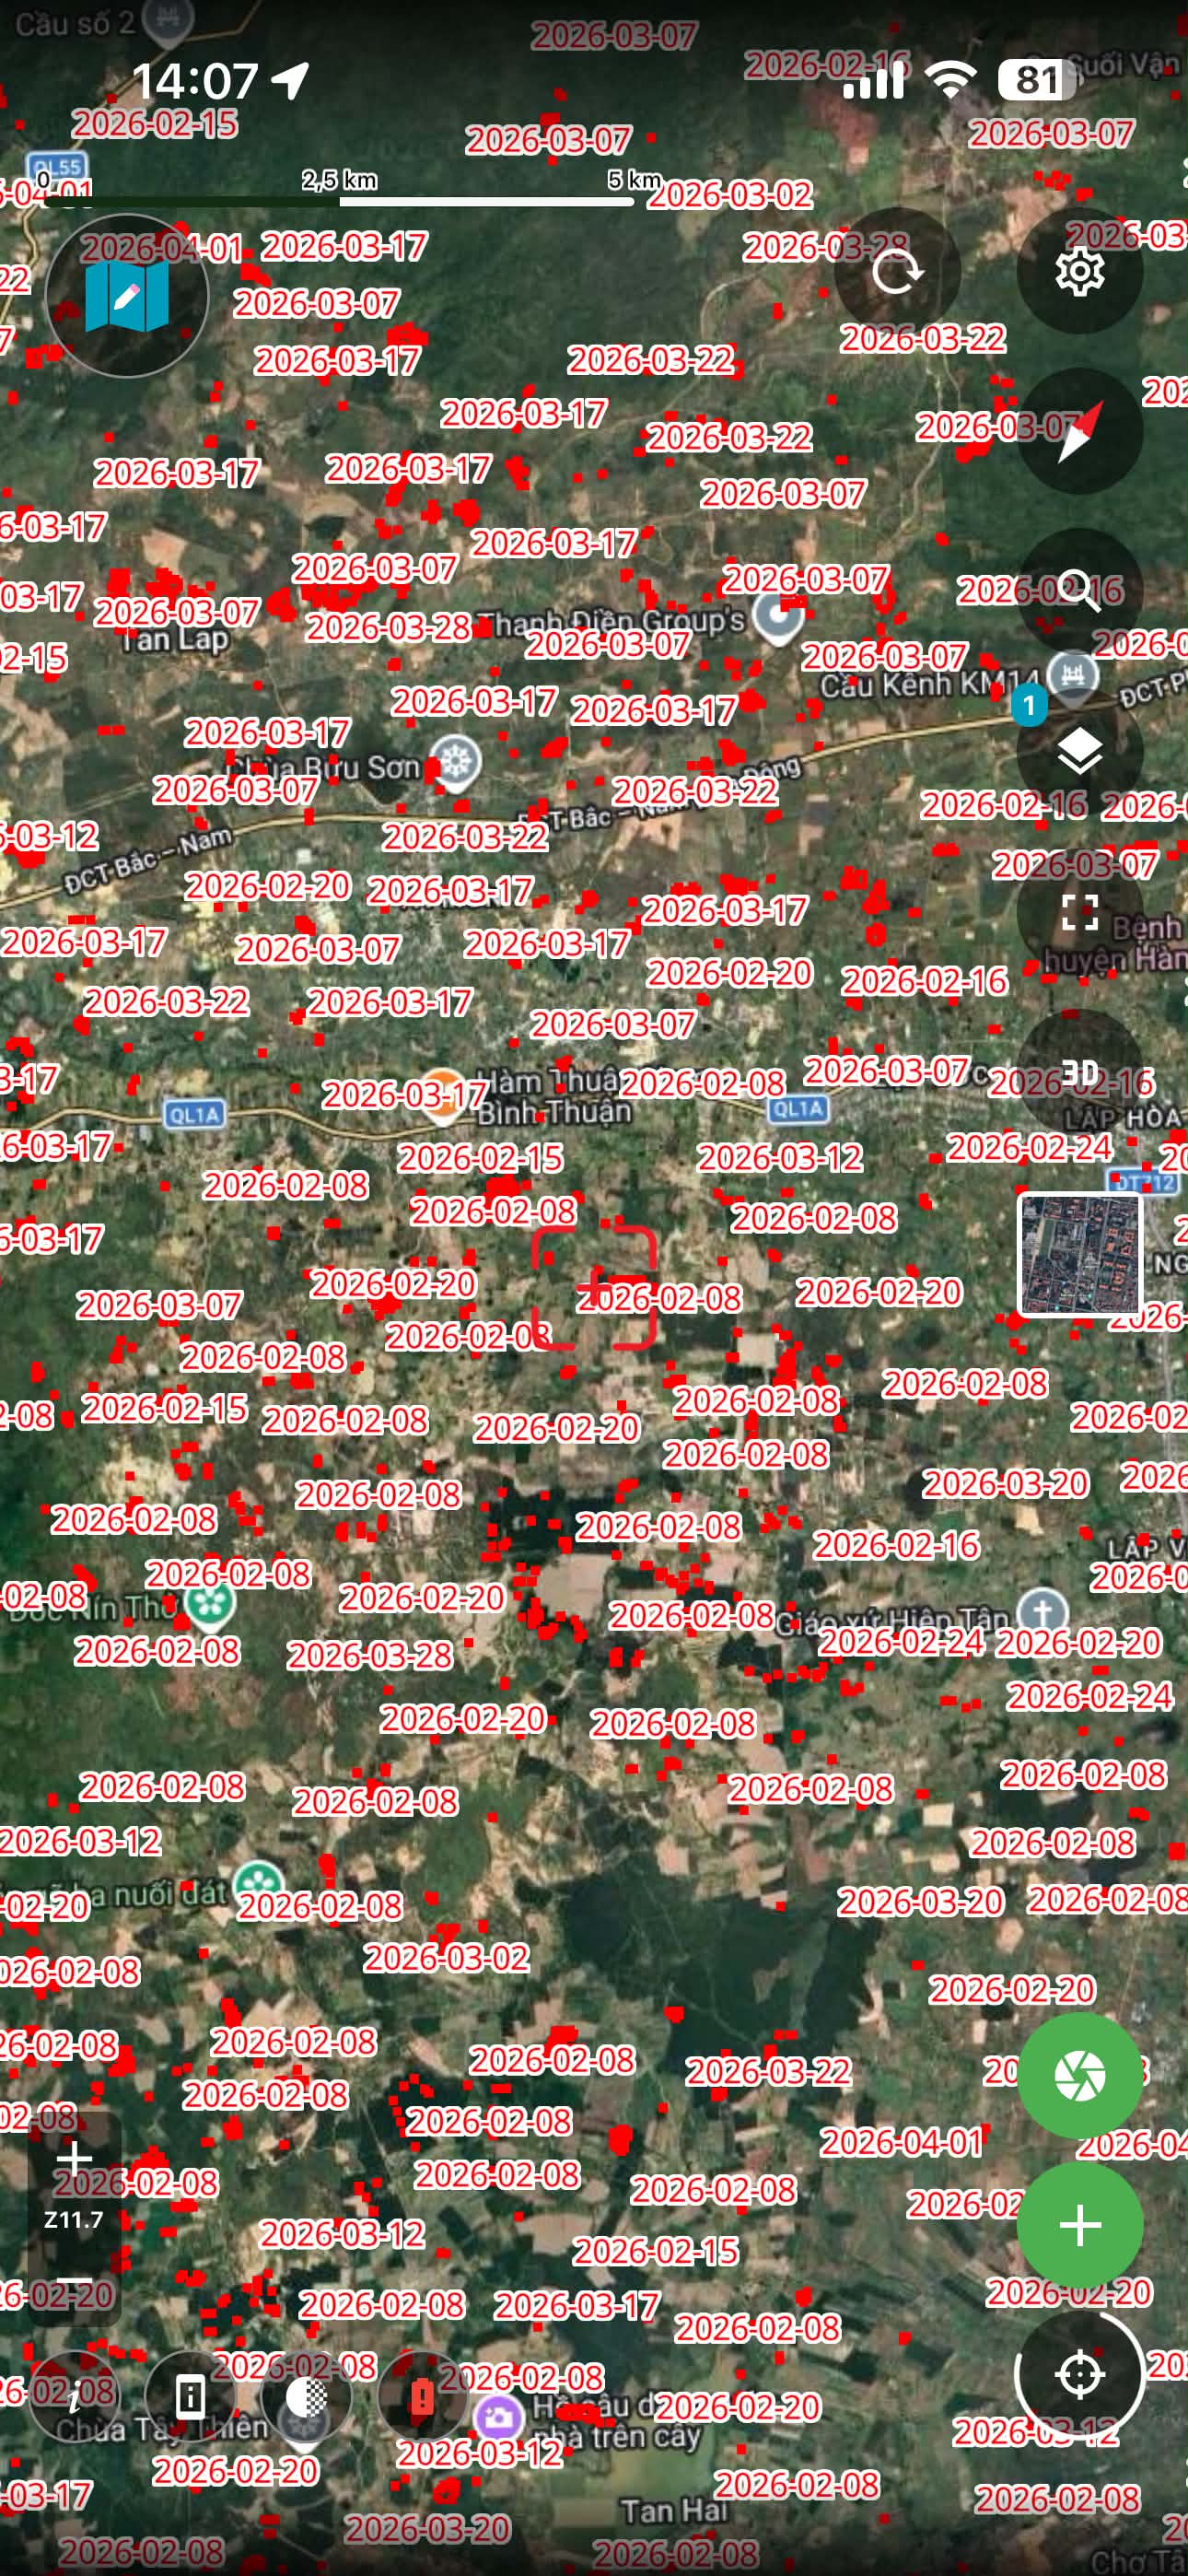
View Forest Changes on Map
After enabling the forest change detection data layer, change parcels will be displayed directly on the map in red-bordered areas.
Each parcel will have information about the time of change detection for easy user monitoring.
Note: The forest change detection data layer only displays starting from level 12 and above.
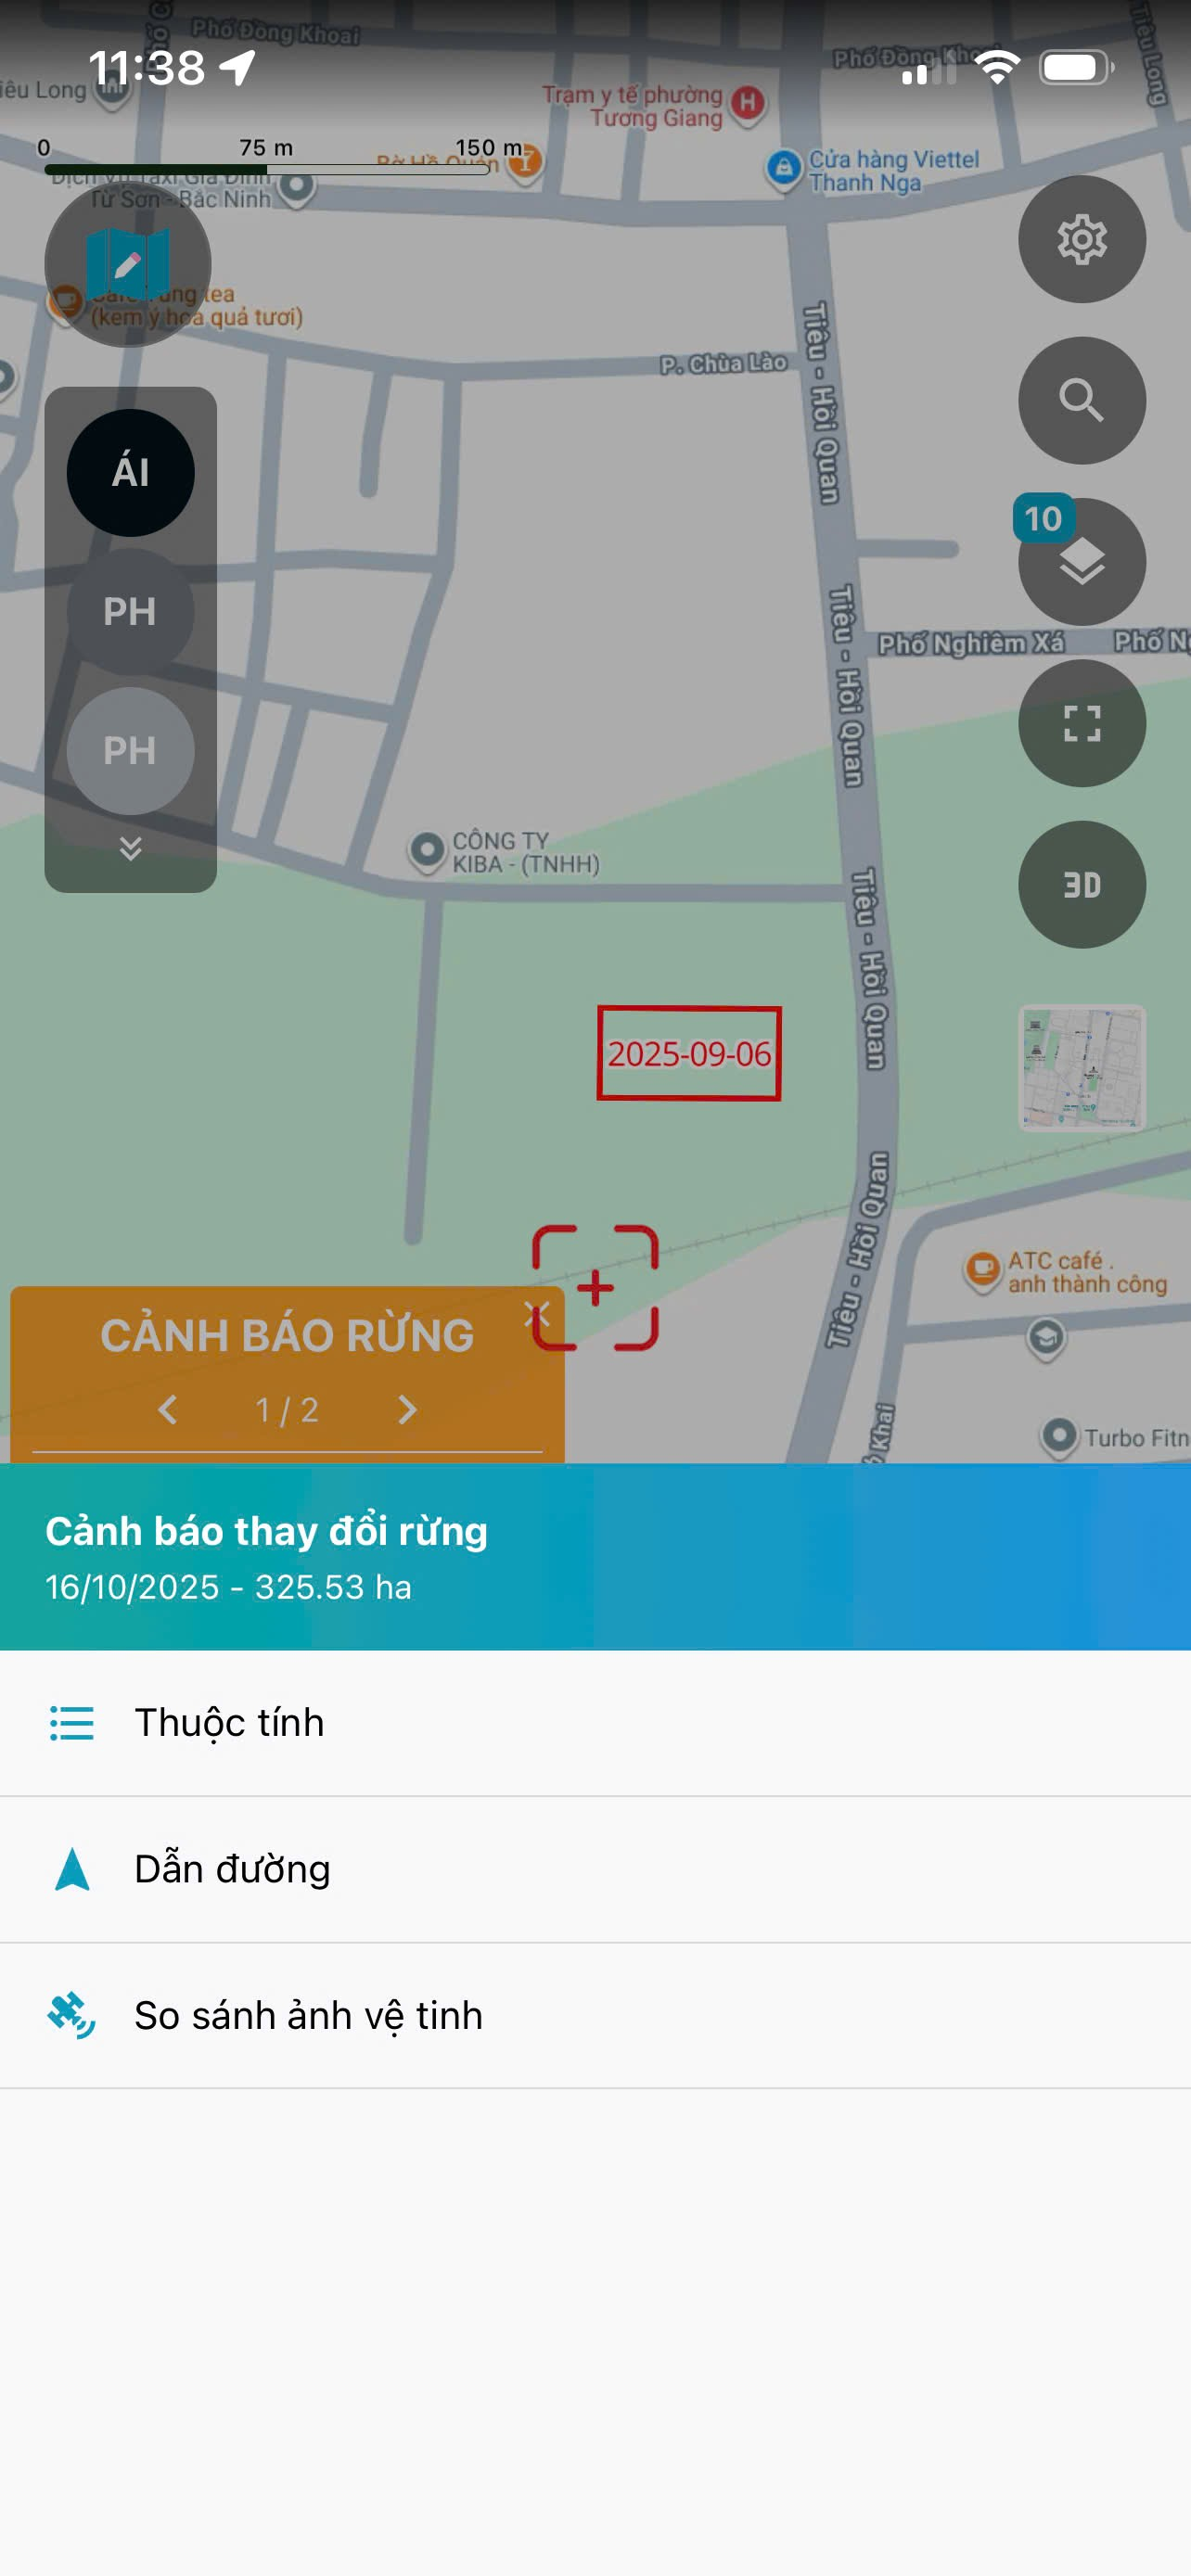
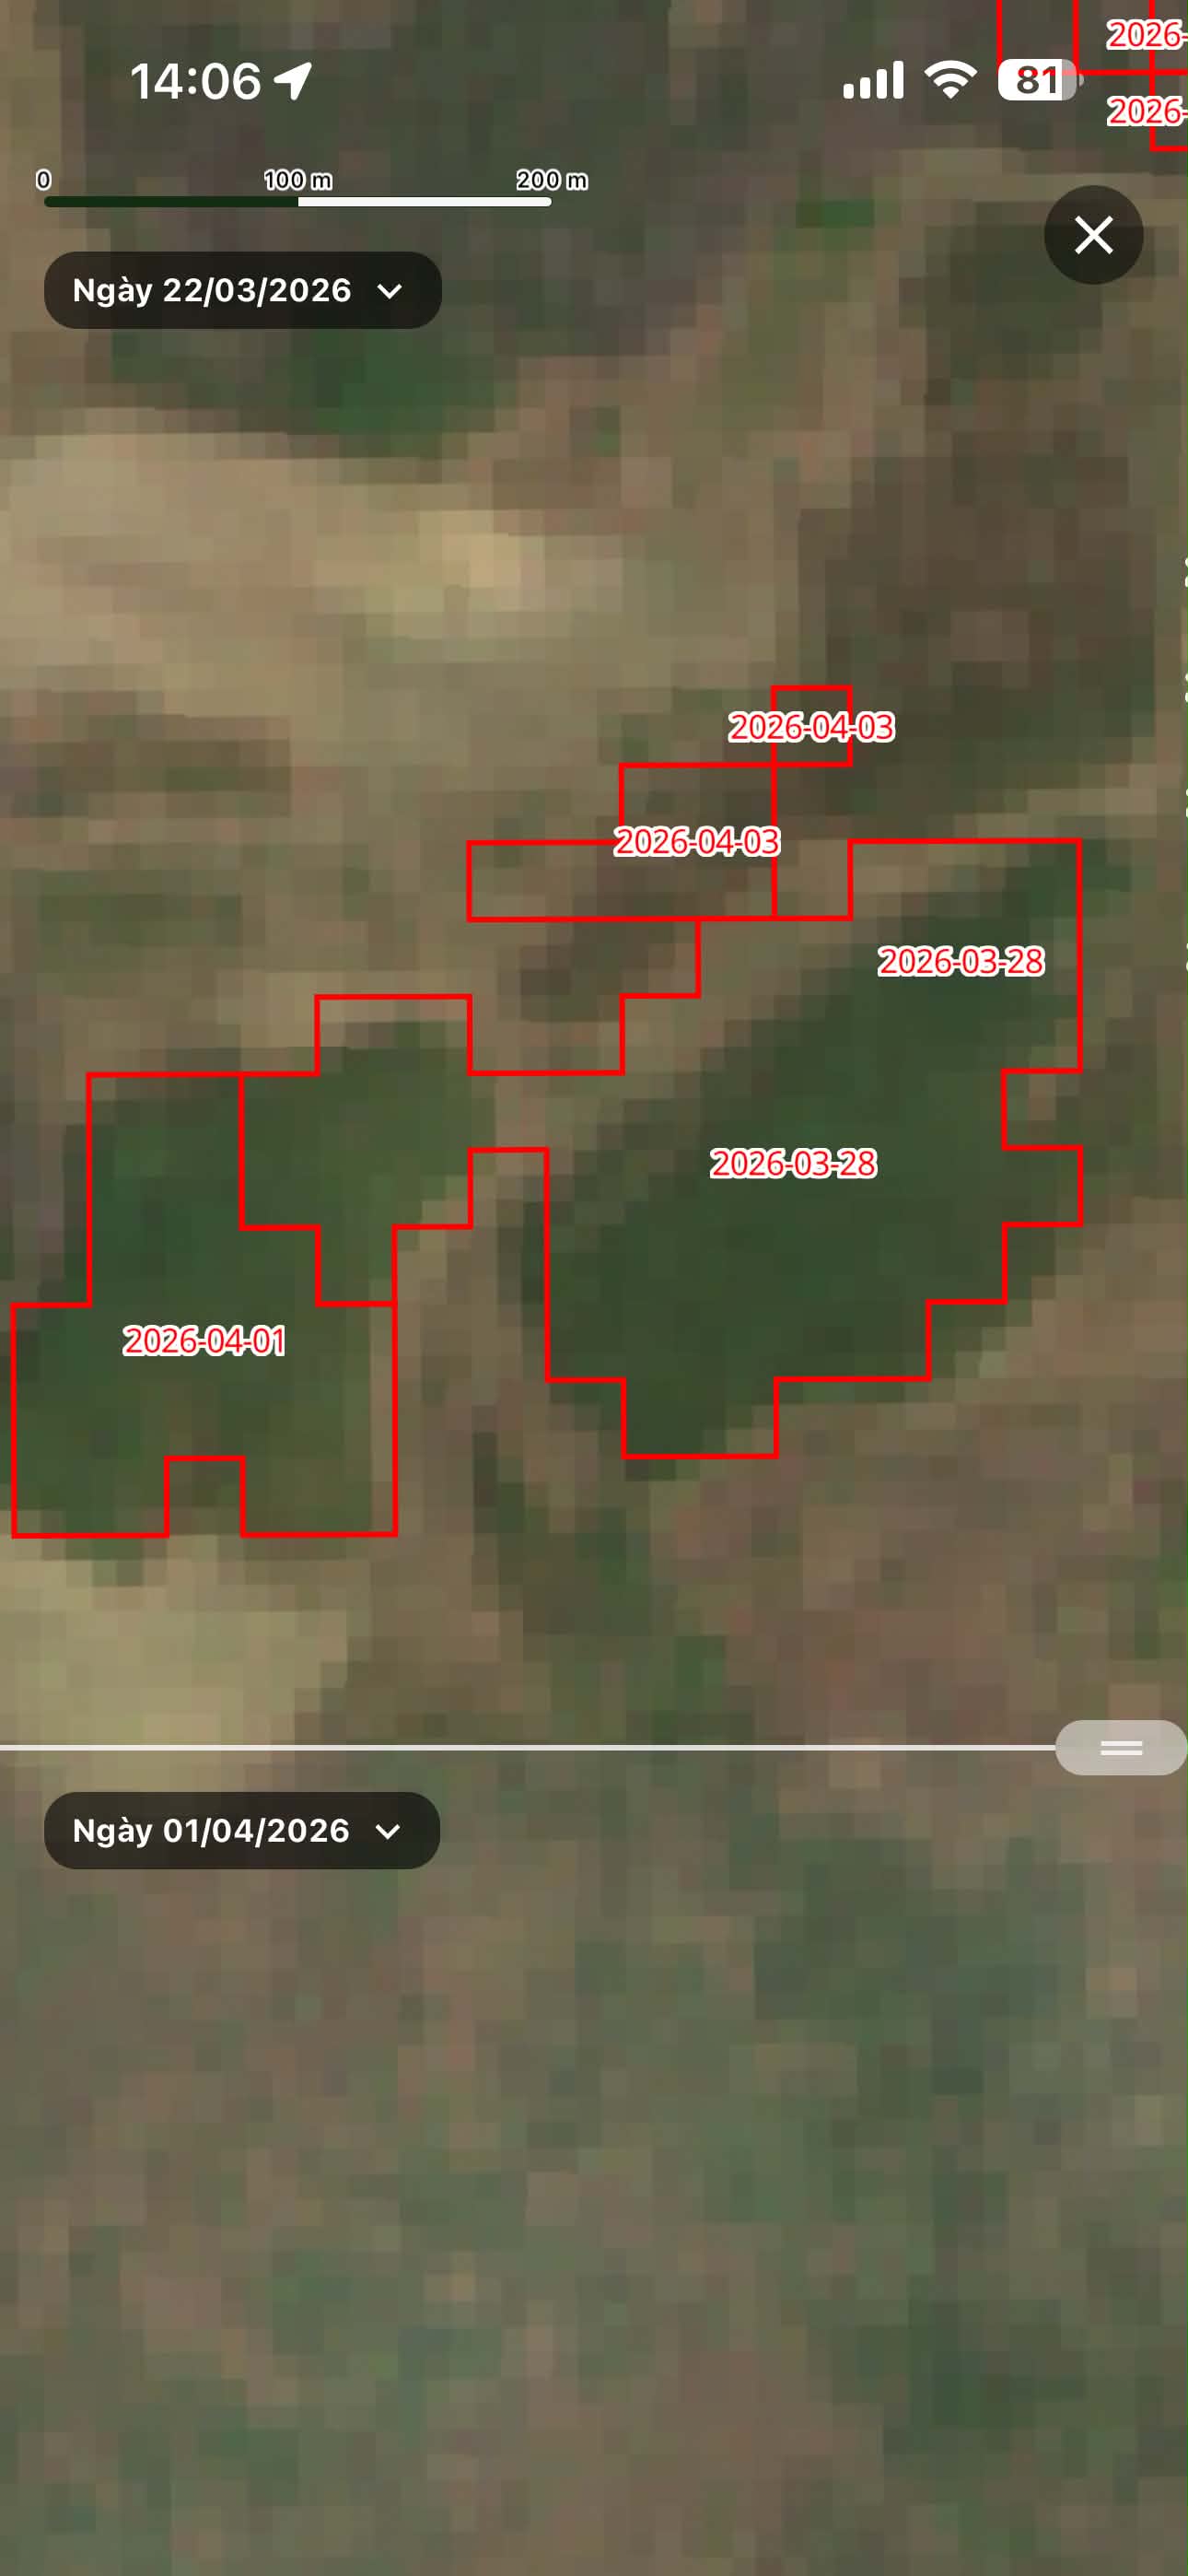
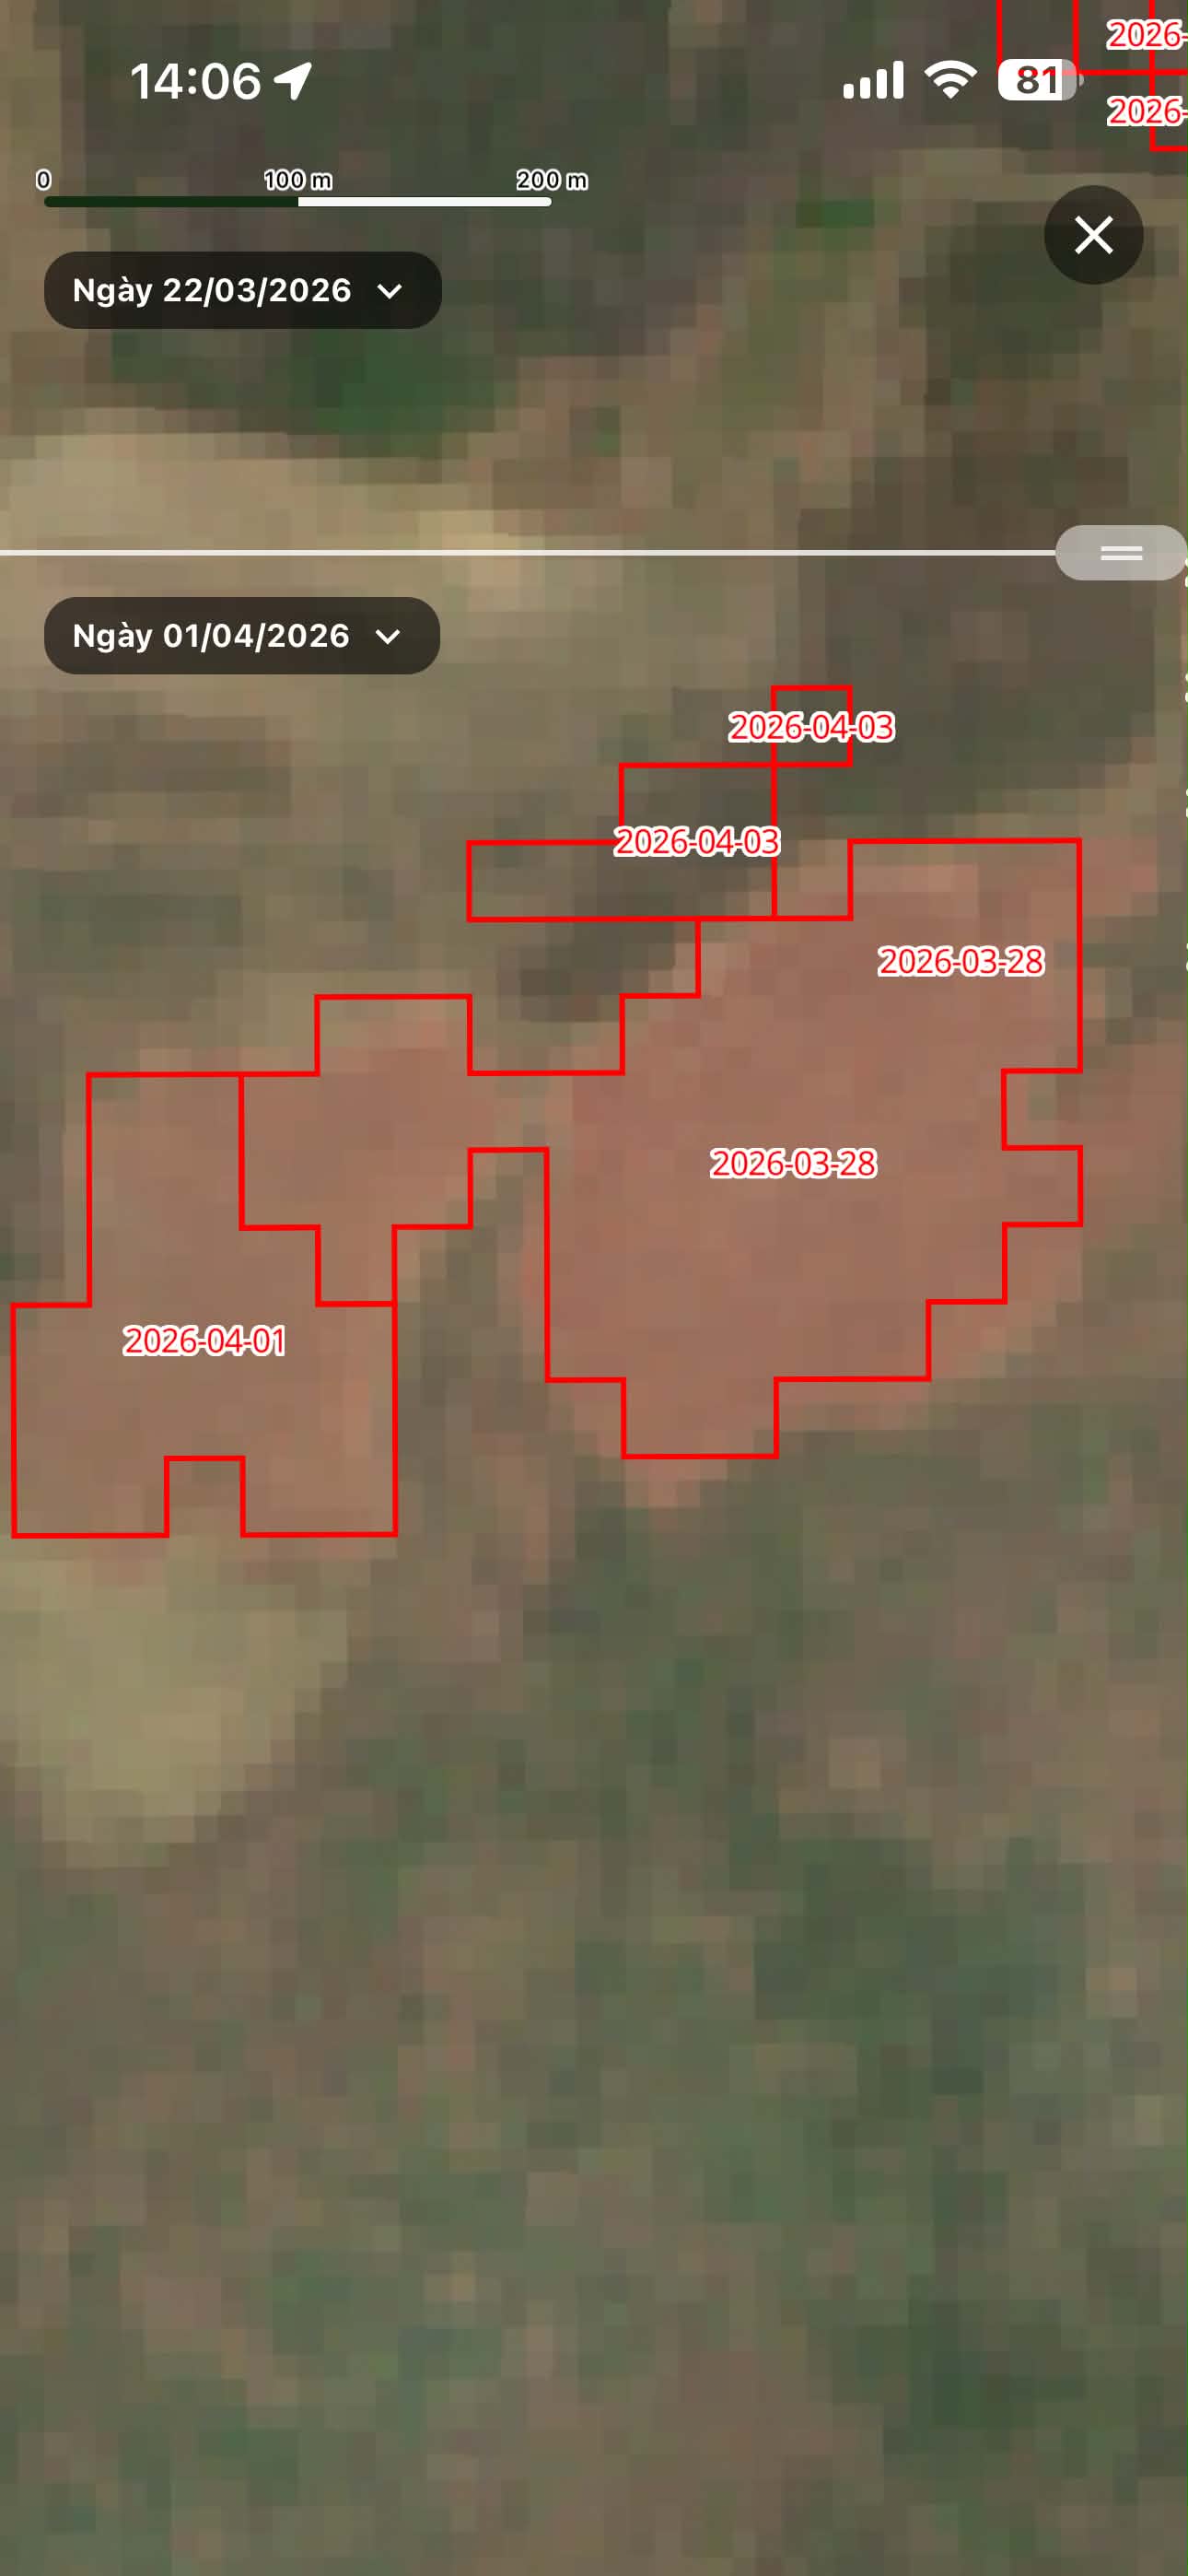
Compare 2 Time Points
When tapping on a forest change parcel, users can select the Compare Satellite Imagery menu to display the satellite imagery comparison screen between two different times.
Users can:
- Select start date and end date
- Drag the slider to see the changes
- Compare forest status before and after the change
This feature helps identify:
- Areas of forest loss
- Areas of vegetation change
- Level of change over time
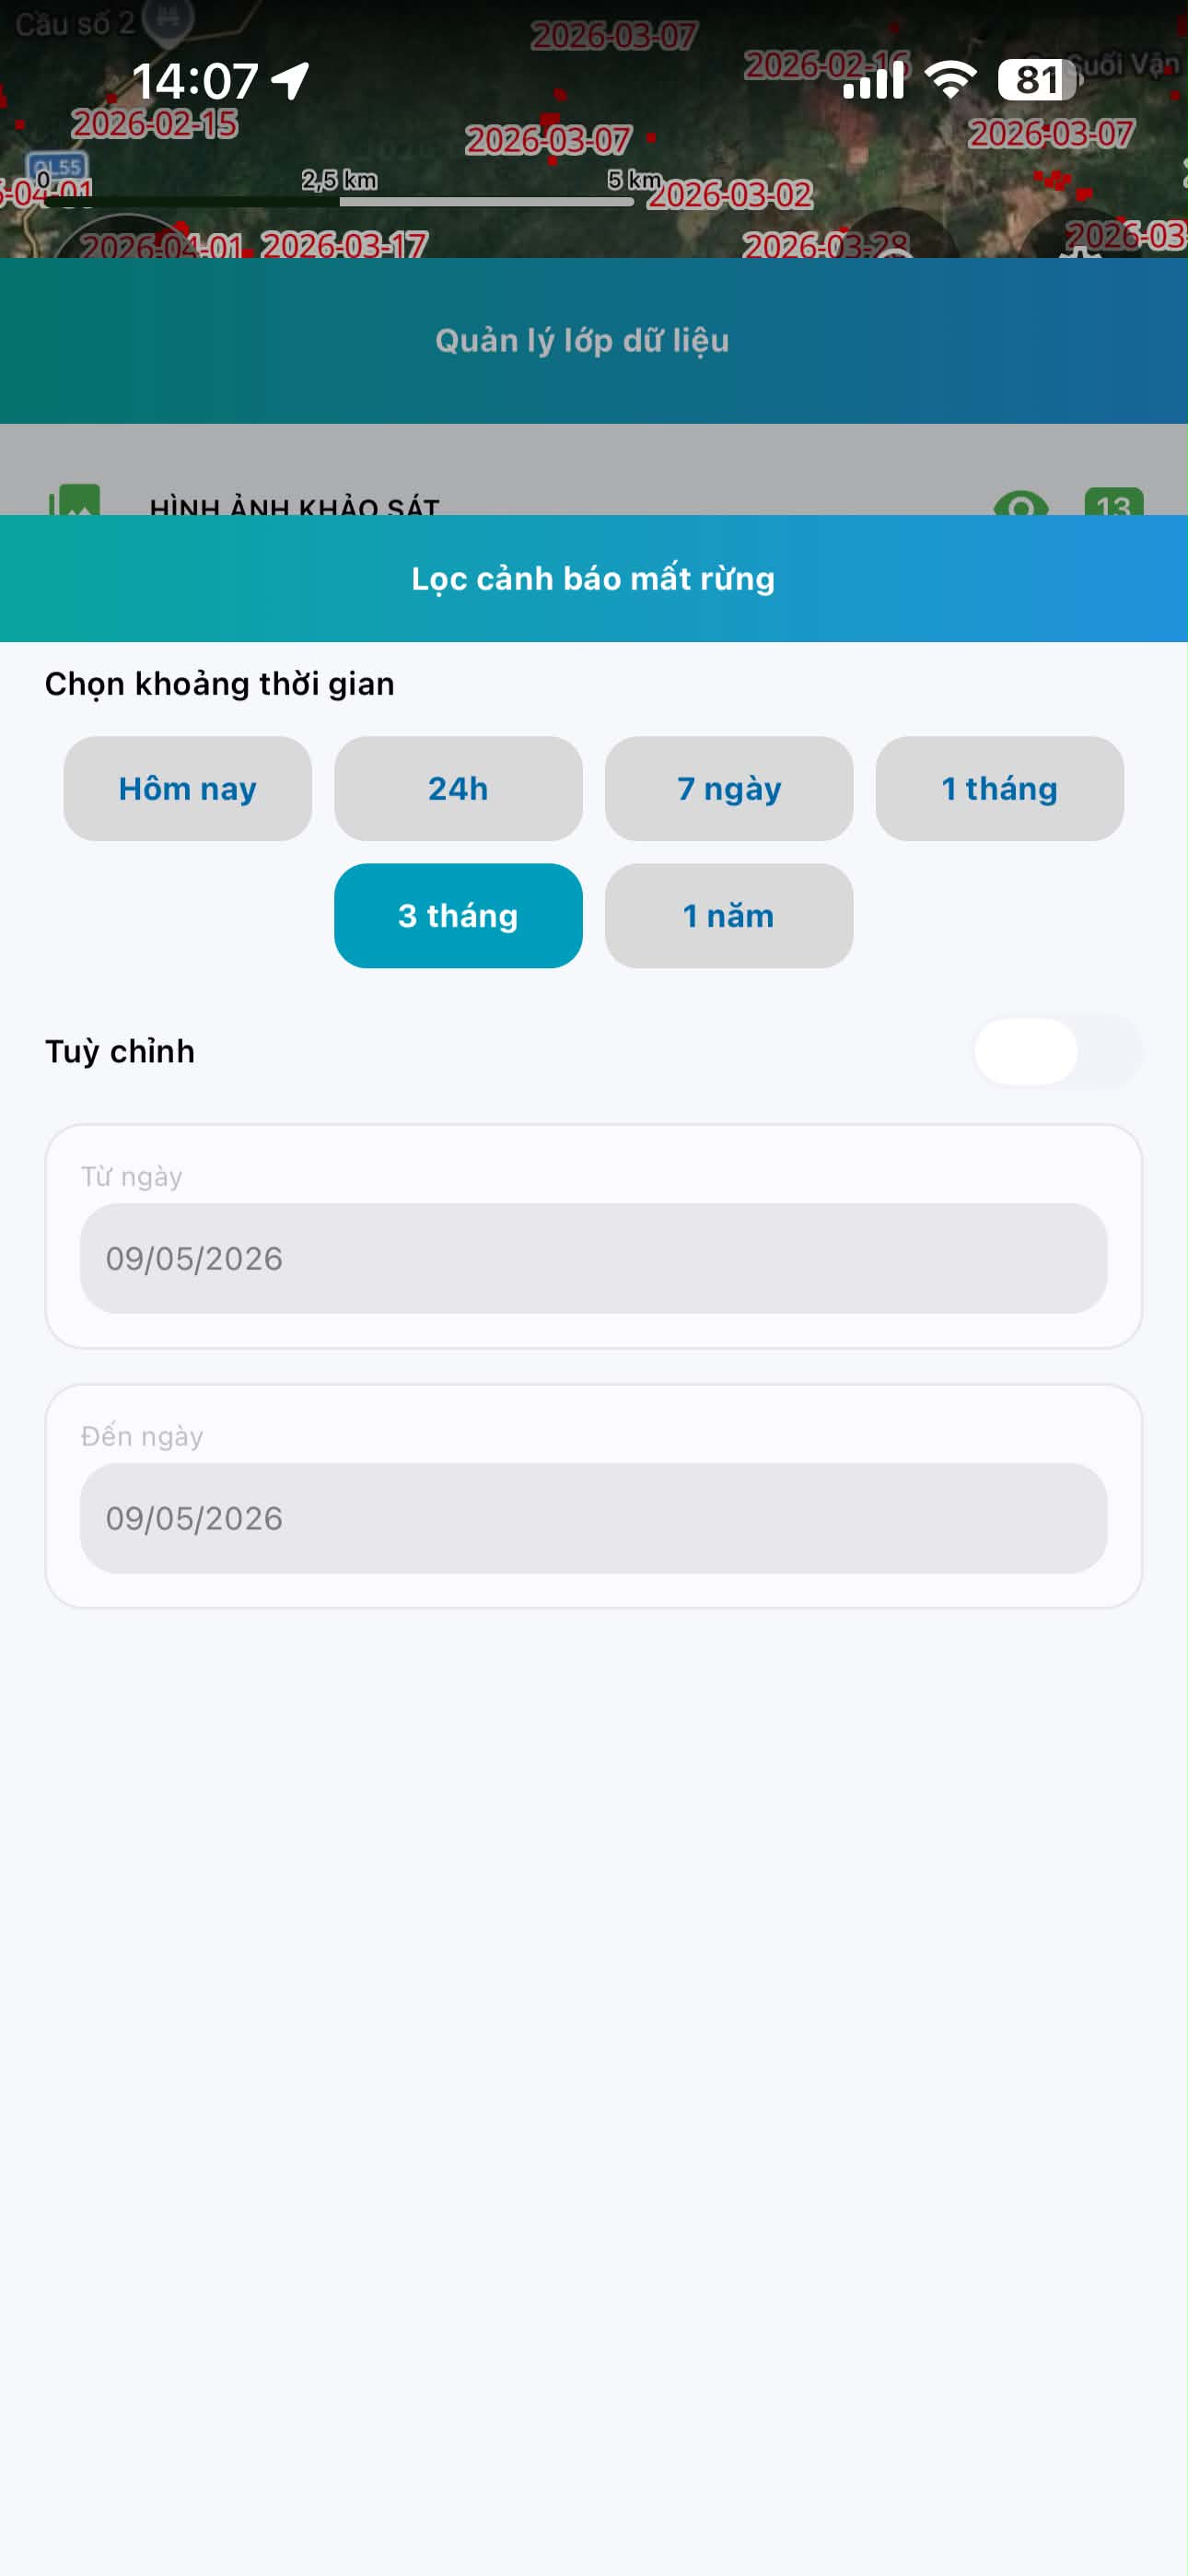
Filter Forest Change Data
If the map displays too much data, users can use the time filter to limit the number of change parcels displayed.
Filter options include:
- Today
- 24 hours
- 7 days
- 1 month
- 3 months
- 1 year
- Custom time period
Filtering data helps the map display more clearly and focus on the area that needs monitoring.
How to Use
Step 1: Open Forest Change Detection Data Layer
On the map screen:
Menu → Manage Data Layers
Then enable the forest change detection data layer to display on the map.
Step 2: Select Change Parcel
Tap on a change parcel on the map to view details.
The application will open the time-based satellite imagery comparison screen.
Step 3: Compare Changes
- Select 2 time points to compare
- Drag the slider across the screen to see the changes
- Observe the changed area directly on satellite imagery
Step 4: Filter Display Time Period
To reduce the amount of data on the map:
- Open the change data filter
- Select the appropriate time period
- Or set a custom time
After applying the filter, the map will only display change parcels within the selected time period.
Benefits of the Feature
This feature helps:
- Monitor deforestation quickly
- Detect abnormal changes
- Support field status inspection
- Reduce time to review satellite imagery data
- Support more effective forest management and protection